Sudoku 4B

My image “Sudoku 4B” was chosen for the American Mathematical Society 2012 Mathematical Imagery calendar (see the 2011 calendar here. Yay!

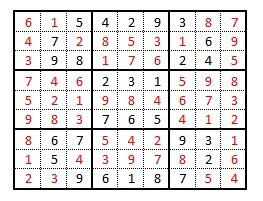
The image is based on the puzzle. In standard Sudoku, a 9 × 9 grid is partially filled with numbers 1 – 9. The objective is to complete the grid, placing a single-digit number into each unfilled square, such that:
  • each number 1 – 9 appears once and only once in each row,
  • each number appears once and only once in each column, and
  • each number appears once and only once in each of the 3 × 3 smaller squares (shown outlined by a thick line below).
The first grid shows an example puzzle, with its solution in the second grid.
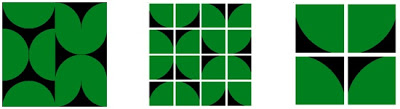
Although the puzzle is generally given with numbers, there’s nothing particularly numeric about Sudoku—it’s about patterns of figures. Letters or other symbols can be used, or, in my case, shapes. Also, a simpler puzzle can be obtained by using a smaller grid, say a 4 × 4. This next grid shows a 4 × 4 Sudoku, using the numbers 1 – 4.
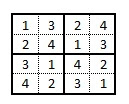
Mapping the numbers to four different (but similar) shapes gives this grid:

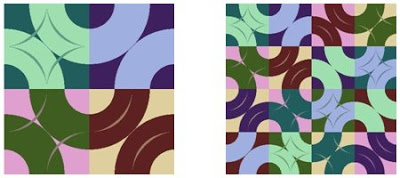
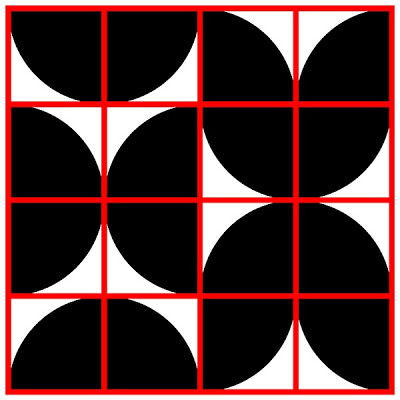
For my image, I did this four times, using four different basic shapes:


and then combined them by adding all four together.

Next stop, a full 9 × 9 Sudoku!

2D Mancala

When I first learned how to play Mancala, I was quite fascinated by the possibilities that opened up when your last stone fell into the home pit, giving you another move in the same turn. I quickly realized that a whole series of moves could be made, given the right layout of stones and judicious play (much to the chagrin of my girlfriend at the time).

Clearly, if you have one stone in the pit closest to the home pit (Pit 1), you can play it and get a free move. If you have one stone in Pit 1 and two in the next pit (Pit 2), then you could have two free moves, allowing you to clear three stones (by playing Pit 1, Pit 2, and then Pit 1 again, in that order). It thus seemed logical to me that one could clear six stones by having three in Pit 3, two in Pit 2 and one in Pit 1, and so on.

Alas, it is not that simple. The most stones that can be cleared with three pits is five (three stones in Pit 3 and one each in Pits 2 and 1). However, the patterns that arise from the question of, “What is the maximum number of stones that can be cleared in one turn (with free moves), using a given number of pits?” are quite interesting (to me, anyway; see my article about it here).

So I started thinking about changing the game. The standard Mancala board has six pits (on each side), which can be viewed as one row of six pits (duh). What might happen if there were more than one row? Say, two rows of pits, or 22 rows. Would it then be possible to clear a board with n stones in each pit of Column n? I kept the rules basically the same: in each move, harvest all the stones in one pit and sow one stone in each column to the right. You can sow a stone into any pit in that column, but you must sow one and only one stone per column. If the last sown stone lands in the Home pit, you get another move.

The cases for one and two columns of pits are easy: you only need one row to clear one stone from one pit or three stones from two pits (two in Pit 2 and one in Pit 1). At three columns, it becomes interesting. Two rows are needed to clear six stones in a row (three in each pit in Column 3, two in each pit in Column 2, and one in each pit in Column 1). Here’s one way to do it:
  1. From row 2, column 1 to home
  2. From row 2, column 2 to row 2, column 1 and to home
  3. From row 2, column 1 to home
  4. From row 1, column 1 to home
  5. From row 1, column 2 to row 1, column 1 and to home
  6. From row 1, column 1 to home
  7. From row 1, column 3 to row 1, column 2, to row 1 column 1, and to home
  8. From row 1, column 1 to home
  9. From row 2, column 3 to row 1, column 2, to row 1, column 1, and to home
  10. From row 1, column 1 to home
  11. From row 1, column 2 to row 1, column 1 and to home
  12. From row 1, column 1 to home
Four columns of pits (with four stones in each pit in Column 4 down to one each in Column 1) takes six rows, while five columns only takes four. The six-column case seems to be where my computational strategies are breaking down. So far, all I’ve found is that clearing six columns can’t be done with six or fewer rows. The number of possibilities is just so large that I haven’t yet found a way to efficiently handle them. But I haven’t given up!

One Fish, Two Fish, Red Fish, Blue Fish

A buddy of mine is considering buying a print of my image, “One Fish, Two Fish, Red Fish, Blue Fish” (he’s very smart!). That is one of my favorites, because of what it is, how it came out, and because Dr. Seuss is just way cool.

Each fish comprises 200 cubic Bézier curves. A Bézier curve is one determined by two anchor points, where the curve begins and ends, and (in this case) two control points, which affect the shape. The Wikipedia page has many examples and animations showing how it all works. Basically, four points lead to a smooth curve that starts at one and ends at another.

Each curve is determined by a different set of four points. Look at blue fish, in the upper right corner, and notice the U shape. This curve (which is not actually drawn, but implied) gives the first anchor points for the 200 blue lines. It is also a cubic Bézier curve. Likewise, the sideways U shape in the upper left provides the second set of anchor points. Two more U shapes, unseen in the lower half of the image, provide the control points. For the red fish, there are two anchor U’s in the bottom of the image and two unseen control U’s in the top half. By using the same basic U shape definitions, both fish have the same basic size and shape. But, by changing them slightly, the fish are similar, but not symmetric.

Even though the fish are red and blue, the actual lines used to create them are not. Well, the blue fish is really blue on a white background. But the red fish is on a different layer, which is cyan on a black background. By subtracting the two layers, the red fish is born. Where the two overlap, bits of green pop in. I like this because it’s simple (red, green, and blue being the basic computer graphics colors), and because I don’t much care for a lot of green.

A055874

What's the next number in this sequence?
1, 2, 1, 2, 1, 3, 1, 2, 1, 2, 1, 4, 1, 2, 1, 2, 1, 3, 1, 2, 1, 2, 1...
A quick look at the Online Encyclopedia of Integer Sequences (you have it bookmarked, don't you?) reveals this sequence to be A055874, "a(n) = largest m such that 1, 2, ..., m divide n." Take, for example, the sixth number in the list, 3. Then, think about the numbers that evenly divide into 6: 1, 2, 3, and 6. The first three divisors start a pattern of counting up from 1, by 1: 1, 2, 3. That patten is broken after the 3, so 3 is the largest number such that all of the positive integers from 1 to that number (i.e., 1, 2, and 3) divide evenly into 6. After the 3 is 1, the seventh number in the list. That means that, when counting up from 1 by 1's, the only numbers that divide evenly into 7 are 1. For 8, the list is 1 and 2, so the eighth number in the list is 2.

So, what is the next number in the list? There are already 23, so the next number is the largest positive integer in the list, starting from 1 and counting by 1's, that divides evenly into 24, or 4.

What else can we tell about this sequence? It contains the numbers 1 - 4; will all positive integers eventually show up? Specifically, when will 5 be seen? For 5 to be in the sequence, then there has to be a number x such that, 1, 2, 3, 4, and 5 all evenly divide into x, but 6 does not (because the numbers in this sequence are the largest in the list from 1). But, if 2 and 3 divide evenly into x, then 6 (2 × 3) will, too, so 6 will be in the list, meaning that 5 won't be the largest. Will 7 make it in the sequence? Yes, it first shows up in spot #420, and 8 in the 840th place. What about 9? In order for 9 to be there, 2 and 5 have to be there first, so 10 (2 × 5) will be in the list of divisors, so 9 won't be the largest. What other numbers are missing?

Every second number in the sequence is 1, because every second positive integer is odd, and for odd numbers, the list of incrementing divisors ends at 1. About one-third of the entries are 2. For two to be there, the product number must be even (2 is a divisor) and must not be a multiple of 3 (or else, 2 wouldn't be the largest in the list). So, the second and fourth entries are 2, but not the sixth or twelfth. In the first 10,000 elements of this sequence, 4 shows up about 1 time in 15, 6 one time in 70, and 7 only shows up 12 times. Can you figure out why? We know why 9 isn't there; how often should 10 occur?

Manifesto

The link in the title goes to an image I created entirely of QR codes--those 2D barcode-like images that are often used to link to websites. QR codes can also be used to encode other things, like phone numbers, email addresses, map coordinates, and just plain text. I used that last option to encode my Fractal Art Manifesto, by breaking it up into 63 little pieces. Each piece was then encoded and the blocks arranged into a 9 × 7 grid. QR codes are typically black on white, but that's not required. So, I tweaked the "black" in each square to give a sense of how to read the image: Start with the blue in the upper left corner and spiral in to the black in the middle and back out to the red in the lower right.

Seemed like a good idea at the time.

Reverse then Add

The “196 algorithm” is the process of starting with a positive integer and iteratively:
  • reversing its digits,
  • adding the reversed number to the previous number, and
  • checking for a palindrome (the digits in the sum read the same left-to-right as right-to-left).
Most numbers lead to palindromes fairly quickly, like 235 (235 + 532 = 767), but some take a while (89 takes 24 steps). The process is named after 196 because that is the smallest positive integer not known to lead to a palindrome. The current record is 375 million digits! By that standard, my achievement of calculating 1000 iterations is positively paltry. But, here ‘tis nonetheless, in all of its 411-digit glory:
35346644392413689785837714402912114362859098083414
08344020861450405992918328457190349563871687958004
63971545914548326676428378028814710683108505496412
73388365259932008237493462055424091251579012001668
76923521977766210101074152201325440264395822899140
06246477437313605494900387117318730883824675524836
40965506947400858697069355944181744933808299515044
25811945379423290791058264410120303427728587887404
29334664452
(Scroll to the end of this post to see what this number is in words.)

One characteristic of this process is that it’s dependent on the base in which the number is expressed--using another base will give different results. In binary (base 2, digits 0 and 1), it turns out that twenty-two (10110) is the smallest number non known to lead to a palindrome.

What about negative numbers? By using a negative base, all integers can be represented without using a negative sign. For example, in base -10 (negadecimal), the places are not ones, tens, hundreds, thousands, etc., but ones, negative tens, hundreds, negative thousands, etc. So the number 29 in negadecimal is equal to -11 in decimal (2 × -10 + 9 × 1 = -20 + 9 = -11). Using this as starting point:
  • 29 negadecimal = -11 decimal
  • Reversing, 92 negadecimal = -88 decimal (9 × -10 + 2 × 1)
  • Adding gives 1901 negadecimal or -99 decimal
  • Reverse (1091 negadecimal, -1089 decimal)
  • Add (-1188 decimal, 2992 negadecimal, palindrome!)
In base -10, 29 leads to a palindrome in two iterations.

And why stop there? How about complex numbers? Using certain complex bases allows one to express any complex number with integer real and imaginary parts (Gaussian integer) as a single unsigned string of digits. For example, base -1+i, (where i2 = -1), works with the digits 0 and 1, like binary. The decimal string “6” can also be expressed in binary as “110.” Interpreting this in base -1+i gives the complex number -1+i. Reversing the string to "011" gives 0+i. Adding yields -1+0i, or "11101." Continuing this process doesn’t seem to lead to a palindrome. After 100 iterations, the binary string is:
11101001011101001111001010011011010111011000100011
10010101101100010110001010100111011110110110001011
11001101000001101001111110110101001101011101011111
010010000
which converts to about -3.2119823593426 × 10²² + 1.10520083032793 × 10²³ i.

More fun can be had by using others bases or by subtracting instead of adding. I'll talk more about that another time.

Oh, and here’s the (American) English version of that 411-digit number from above, courtesy of the “Name of a Number” site:

Three hundred fifty three cenquintrigintillion, four hundred sixty six cenquattuortrigintillion, four hundred forty three centretrigintillion, nine hundred twenty four cenduotrigintillion, one hundred thirty six cenuntrigintillion, eight hundred ninety seven centrigintillion, eight hundred fifty eight cennovemvigintillion, three hundred seventy seven cenoctovigintillion, one hundred forty four censeptenvigintillion, twenty nine censexvigintillion, one hundred twenty one cenquinvigintillion, one hundred forty three cenquattuorvigintillion, six hundred twenty eight centrevigintillion, five hundred ninety cenduovigintillion, nine hundred eighty cenunvigintillion, eight hundred thirty four cenvigintillion, one hundred forty cennovemdecillion, eight hundred thirty four cenoctodecillion, four hundred two censeptendecillion, eighty six censexdecillion, one hundred forty five cenquindecillion, forty cenquattuordecillion, five hundred ninety nine centredecillion, two hundred ninety one cenduodecillion, eight hundred thirty two cenundecillion, eight hundred forty five cendecillion, seven hundred nineteen cennovemtillion, thirty four cenoctotillion, nine hundred fifty six censeptentillion, three hundred eighty seven censextillion, one hundred sixty eight cenquintillion, seven hundred ninety five cenquattuortillion, eight hundred centretillion, four hundred sixty three cenduotillion, nine hundred seventy one cenuntillion, five hundred forty five centillion, nine hundred fourteen novemnonagintillion, five hundred forty eight octononagintillion, three hundred twenty six septennonagintillion, six hundred seventy six sexnonagintillion, four hundred twenty eight quinnonagintillion, three hundred seventy eight quattuornonagintillion, twenty eight trenonagintillion, eight hundred fourteen duononagintillion, seven hundred ten unnonagintillion, six hundred eighty three nonagintillion, one hundred eight novemoctogintillion, five hundred five octooctogintillion, four hundred ninety six septenoctogintillion, four hundred twelve sexoctogintillion, seven hundred thirty three quinoctogintillion, eight hundred eighty three quattuoroctogintillion, six hundred fifty two treoctogintillion, five hundred ninety nine duooctogintillion, three hundred twenty unoctogintillion, eighty two octogintillion, three hundred seventy four novemseptuagintillion, nine hundred thirty four octoseptuagintillion, six hundred twenty septenseptuagintillion, five hundred fifty four sexseptuagintillion, two hundred forty quinseptuagintillion, nine hundred twelve quattuorseptuagintillion, five hundred fifteen treseptuagintillion, seven hundred ninety duoseptuagintillion, one hundred twenty unseptuagintillion, sixteen septuagintillion, six hundred eighty seven novemsexagintillion, six hundred ninety two octosexagintillion, three hundred fifty two septensexagintillion, one hundred ninety seven sexsexagintillion, seven hundred seventy six quinsexagintillion, six hundred twenty one quattuorsexagintillion, ten tresexagintillion, one hundred seven duosexagintillion, four hundred fifteen unsexagintillion, two hundred twenty sexagintillion, one hundred thirty two novemquinquagintillion, five hundred forty four octoquinquagintillion, twenty six septenquinquagintillion, four hundred thirty nine sexquinquagintillion, five hundred eighty two quinquinquagintillion, two hundred eighty nine quattuorquinquagintillion, nine hundred fourteen trequinquagintillion, six duoquinquagintillion, two hundred forty six unquinquagintillion, four hundred seventy seven quinquagintillion, four hundred thirty seven novemquadragintillion, three hundred thirteen octoquadragintillion, six hundred five septenquadragintillion, four hundred ninety four sexquadragintillion, nine hundred quinquadragintillion, three hundred eighty seven quattuorquadragintillion, one hundred seventeen trequadragintillion, three hundred eighteen duoquadragintillion, seven hundred thirty unquadragintillion, eight hundred eighty three quadragintillion, eight hundred twenty four novemtrigintillion, six hundred seventy five octotrigintillion, five hundred twenty four septentrigintillion, eight hundred thirty six sextrigintillion, four hundred nine quintrigintillion, six hundred fifty five quattuortrigintillion, sixty nine tretrigintillion, four hundred seventy four duotrigintillion, eight untrigintillion, five hundred eighty six trigintillion, nine hundred seventy novemvigintillion, six hundred ninety three octovigintillion, five hundred fifty nine septenvigintillion, four hundred forty one sexvigintillion, eight hundred seventeen quinvigintillion, four hundred forty nine quattuorvigintillion, three hundred thirty eight trevigintillion, eighty two duovigintillion, nine hundred ninety five unvigintillion, one hundred fifty vigintillion, four hundred forty two novemdecillion, five hundred eighty one octodecillion, one hundred ninety four septendecillion, five hundred thirty seven sexdecillion, nine hundred forty two quindecillion, three hundred twenty nine quattuordecillion, seventy nine tredecillion, one hundred five duodecillion, eight hundred twenty six undecillion, four hundred forty one decillion, twelve nonillion, thirty octillion, three hundred forty two septillion, seven hundred seventy two sextillion, eight hundred fifty eight quintillion, seven hundred eighty eight quadrillion, seven hundred forty trillion, four hundred twenty nine billion, three hundred thirty four million, six hundred sixty four thousand, four hundred fifty two.

Penrose Pursuit

Penrose tiles are sets of polygonal tiles that can be assembled into non-periodic tessellations of the plane. There are three major variations of Penrose tiles; I’ve concentrated on the P3, or rhombus tiles. The set is composed of two rhombi, the thin and fat variations. This figure shows two fat rhombi and one thin:

I decided to fill each tile with a design that gives rise to a series of pursuit curves. By drawing many similar shapes inside, each slightly smaller than the last, the corners will lie on four graceful curves that model the path of an object pursuing another object. Here is a series of 150 quadrilaterals inside the fat tile:

Given that motif, it’s then simply (!) a matter of placing over 150 tiles into a rectangular space:

and filling each tile, taking care to aligning the curves to force aperiodicity. Voila!

Palindrome Equations

Comedian Demetri Martin wrote a 224-word poem that is a palindrome. That is, if you remove all spaces and punctuation, the string of letters reads the same forward as it does backward.

When I heard about this, I started thinking about palindrome equations—if you remove all the operators (e.g., +, - ×, ÷, etc.), the number string reads the same forward as it does backward. Turns out, it’s easy to make palindrome equations. For example:
  • 0 + 0 = 0 × 0
  • 1 + 2 – 3 = 3 – 2 – 1
  • 122 = 2 ÷ 2 ÷ 1
The first form can be made arbitrarily long, just by adding more 0’s. Also, it’s not that hard to make palindromes using large numbers:

0 × 12,345,543,211,234,554,321 = 1,234,554,321 – 1,234,554,321 + 0

So, creating palindrome equations is not particularly tough. Nonetheless, I decided to create some that weren’t trivial—they don’t involve multiplying or dividing by 1 or adding or subtracting 0. Here are some basic multiplication equations (the numeric palindrome is shown in parentheses):
  • 126 = 6 × 21 (126621)
  • 441 × 184 = 81,144 (44118481144)
  • 2,102,540 = 1045 × 2012 (210254010452012)
  • 2803 × 3294 = 9,233,082 (280332949233082)
Then, I decided to branch out into more complicated forms. Like fractions:
  • 25/8 = 5/8 + 5/2 (2585852)
  • 34/13 - 51/33 = 153/143 (34135133153143)
  • 4/17 + 19/42 = 491/714 (4171942491714)
  • 722/45 = 88/5 - 42/27 (722458854227)
And powers:
  • 52 × 2 = 52 + 25 (5225225)
  • 74 × 27,356 = 65,665,372 + 47 (74273566566537247)
  • 53,240 × 43 = 55 + 3,404,235 (5324043553404235)
  • 7538 × 42 = 42,483 + 57 (7538424248357)
No luck yet on a 224-term palindrome equation.

2 ^ 10,000

210,000 is:

1995063116880758384883742162683585083823
4968318861924548520089498529438830221946
6319199616840361945978993311294232091242
7155649134941378111759378593209632395785
5730046793794526765246551266059895520550
0869181933115425086084606181046855090748
6608962488809048989483800925394163325785
0621568309473902556912388065225096643874
4410467598716269854532228685381616943157
7562964076283688076073222853509164147618
3956381458969463899410840960536267821064
6214273333940365255656495306031426802349
6940033593431665145929777327966577560617
2582031407994198179607378245683762280037
3028854872519008344645814546505579296014
1483392161573458813925709537976911927780
0826957735674444123062018757836325502728
3237892707103738028663930314281332414016
2419567169057406141965434232463880124885
6147305207431992259611796250130992860241
7083408076059323201612684922884962558413
1284406153673895148711425631511108974551
4203313820202931640957596464756010405845
8415660720449628670165150619206310041864
2227590867090057460641785695191145605506
8251250406007519842261898059237118054444
7880729063952425483392219827074044731623
7676084661303377870603980341319713349365
4622700563169937455508241780972810983291
3144035718775247685098572769379264332215
9939987688666080836883783802764328277517
2273657572744784112294389733810861607423
2532919748131201976041782819656974758981
6453125843413595986278413012818540628347
6649088690521047580882615823961985770122
4070443305830758690393196046034049731565
8320867210591330090375282341553974539439
7715257455290510212310947321610753474825
7407752739863482984983407569379556466386
2187456949927901657210370136443313581721
4311791398222983845847334440270964182851
0050729277483645505786345011008529878123
8947392869954083434615880704395911898581
5145779177143619698728131459483783202081
4749821718580113890712282509058268174362
2057747592141765371568772561490458290499
2461028630081535583308130101987675856234
3435389554091756234008448875261626435686
4883351946372037729324009445624692325435
0400678027273837755376406726898636241037
4914109667185570507590981002467898801782
7192595338128242195402830275940844895501
4676668389697996886241636313376393903373
4558014076367418777110553842257394991101
8646821969658165148513049422236994771476
3069155468217682876200362777257723781365
3316111968112807926694818872012986436607
6855163986053460229787155751794738524636
9446923087894265948217008051120322365496
2881690357391213683383935917564187338505
1097027161391543959099159815465441733631
1656936031122249937969999226781732358023
1118626445752991357581750081998392362846
1524988108896023224436217377161808635701
5468484058622329792853875623486556440536
9626220189635710288123615675125433383032
7002909766865056855715750551672751889919
4129711337690149916181315171544007728650
5731895574509203301853048471138183154073
2405331903846208403642176370391155063978
9000742853672196280903477974533320468368
7958685802379522186291200807428195513179
4815762444829851846150970488802727472157
4688131594750409732115080498190455803416
8269497871413160632106863915116817743047
92596709376


Just in case you were curious.

I really do have a reason why I calculated this and, hopefully, it'll be the subject of another post.

Inspired


This image is a visual representation of using the Stern-Brocot tree to approximate real numbers.

The Stern-Brocot tree is a way to list all of the positive fractions, once and only once, in lowest terms. Quite a feat. It starts with the "fractions" 0/1 (a true fraction, 0) and 1/0 (not a fraction or even a number, but it works in this context) as bookends (in light gray, below). The first actual row has the fraction 1/1 (shown in green) in between the bookends. In each subsequent row, new fractions are placed between each pair in the row above. The new numerator is the sum of the numerators of the parent fractions and the denominator is the sum of the denominators of the parents (note: this is not the correct way to add fractions). The new fractions are called the mediants of the parents. For example, the 1/2 (in red) comes from adding the 0 from the left bookend + 1 from 1/1, and the 2 comes from 1 from the left bookend + 1 from 1/1. Likewise, 2/1 (in blue) comes from adding 1 + 1 in the numerator and 1 + 0 in the denominator.


Another use for the tree is finding fractions that approximate irrational numbers. The process is to march down the rows of the table, finding the two fractions that bracket the number of interest. As you go further and further down the table, the approximation becomes better and better. For example, consider Φ, which is approximately 1.618. Φ is larger than 1, so in the first row, it is bracketed by 1/1 and 1/0 (which acts like infinity). Then, find the mediant of 1/1 and 1/0, which is 2/1. Compare the mediant with the target number: Φ is smaller than 2, so 2/1 becomes the new higher fraction (and 1/1 stays the lower fraction). The mediant of 1/1 and 2/1 is 3/2, in the third row of the table. Comparing Φ with 3/2, Φ is larger, so 3/2 is the new lower fraction and 2/1 stays the higher fraction. Lather, rinse, repeat for as long as you like. The process is illustrated below, where the red arrow shows about where Φ is, relative to the right half of the tree.


So what does this have to do with the image at the top of the page? At each step of the process, the new mediant is either smaller than or larger than the target number (if the number is irrational). Color a pixel black if the mediant is smaller and white if larger, and you have a column of black or white pixels. Use more columns for more numbers and you have an image. That's what I did for Inspired. The image is centered horizontally on Φ and each row of pixels represents another step in the process (for the image, I started with the bottom row and moved up, instead of moving down as in these examples). The spires in the image come from fractions in the range of the numbers considered. Those with smaller denominators (in lowest terms) will lead to larger spires, where the process stops earlier.

Variations on the Cornu Spiral

The Cornu spiral arises from plotting the two Fresnel integrals against each other. It's a nice, simple spiral that winds up tightly at each end:
As any calculus student can tell you, integration is not a trivial task and the Fresnel integrals are no exception. They don't have a nice analytical form, like, say the integral of 3x2 = x3 + C. Instead, they are evaluated numerically. Generally, computers do this sort of thing quite well, but there are always pitfalls awaiting the naive numerical analyst. Integration typically proceeds by computing a function, marching ahead a step, computing a new value, and repeating until the desired answer is obtained. With the Fresnel integrals and the Cornu spiral, the answer depends greatly on how many steps and how big they are. Here are four different version of the right half of the spiral, each with a slightly different number of steps taken in the integration. Note that all four versions begin together (at the central black dot), but then take off in their own directions. Whereas the correct spiral has only one point (on the right half) about which the spiral winds, each of the approximations stops at a point, winds in, then winds out to moves on to another point.
More fun can be had by tweaking the formulas to be integrated. The correct version works on the functions sin(θ2) and cos(θ2), where θ represents an angle. Why not use other powers of θ? Here's what can happen with exponent values that are close to, but not quite, 2:
Each curve uses a different pair of exponents (say, 1.99 for sin and 2.01 for cos). The curves again start out together, but then take off individually and now don't even maintain the same shape as the original spiral. For even more fun, try different integration methods. Here, I used the trapezoidal rule, but you can find different variations by using the midpoint rule or Simpson's rule, or even combinations of the three.

These are the basic techniques that I used in my images Green Belt and Chocolate City.

Cardioid Boundary Orbits

Points on the edge of the main cardioid of the Mandelbrot set straddle two worlds. The interior of the cardioid contains points with fixed-point orbits: the orbits eventually settle down to a final value. Points immediately outside of the main cardioid are either divergent (their orbits go to infinity) or periodic (their orbits settle down into a loop). Right on the boundary, if the point is the point of tangency of a disk, then the orbit will combine both fixed point and periodic behaviors--it will converge to a final value, but do so very slowly and through a loop of values. Below are shown the orbits for the points tangent to the 1/4, 2/5, and 5/8 disks.


This coloring is based on points on the edge of the main cardioid that are not tangent points for disks. Since they are not associated with periodic disks, these points have orbits that are chaotic, not periodic. They wander around a well-defined region, but never exactly retrace their steps.


Finding these points is easy, if you know where to look. All points along the boundary of the main cardioid can be characterized by an angle, from 0° at the cusp (c = 0.25), positive counter-clockwise to 120° at the top (tangent to the 1/3 disk, c ~ -0.125,0.65), 180° at the neck (tangent to the 1/2 disk, c = -0.75), 240° at the bottom (tangent to the 2/3 disk, c ~ -01.25, -0.65), and 360° back at the cusp. Alternatively, the angle can be expressed in radians, where one full circle, or 360°, is 2π radians (about 6.28). Thus, the above angles correspond to 0, 2π/3, π, 4π/3, and 2π radians. Another angle unit is the turn, where one full circle is one turn. This is handy because the angle of a tangent point, measured in turns, is exactly the same as the fraction for that disk. So, to find a point that is not a tangent point, we need the angle to not be a fraction of a turn, or not a fraction time 2π radians, or not a fraction times 360°. Since π is an irrational number, as is any fraction of it, one easy way to find such angles is for them to have a whole number of radians, like 1, 2, or 4. The orbits for points at these angles look very different from the orbits of tangent points:


So what? Well, if these points have chaotic orbits, then that means that neighboring orbits diverge very quickly. Or, the orbits of two points that start out very close together will soon move very far apart. We can illustrate this by making a new orbit out of the difference between the orbits of two points, and see where that goes. That’s what this coloring does. Here is the orbit between 1.999 radians and 2.001 radians.


Another way to see the difference between the two numbers is to form their ratio. Here’s what happens with these two angles:


If you can take the difference or ratio of two numbers, you may as well add and multiply them, too, and do all sorts of other fun things.


Dry Spell

I've been going through a bit of a dry spell lately and my dry spells are often associated with bumps in other aspects of my life (which is cause and which is effect is something for another time). So, I forced myself to sit and create a few images today, knowing that much of the artistic process is just "showing up." I wound up revisiting some old images and techniques, one result of which is shown here.


I like this technique, multiplying two Rose Range Lite layers, one with angle and one with magnitudue, because of the smoothness and lighting effects it creates. It's also quick to render, which is good when I'm impatient for results, and now, reminds me of blown glass. In this image, I've used the technique on a popcorn formula, which serves essentially as a transform to warp the rose curves into fanciful abstract, yet coherent, shapes.

Tiling

I've always been a fan of tiled designs and my interest in them was reinvigorated when I saw Asao Tokolo's works. So, I set out to create a coloring in Ultra Fractal that could generate similar patterns. My first efforts were with elliptical arcs (generally, quarter- and half-ellipses), as they can easily be made to enter and exit a square tile perpendicular to the edge. This makes the curves smooth over the image.


Above is a real simple example using a single tile (in the center, highlighted). This tile uses four arcs, two quarter-ellipses (quarter-circles, actually, centered on the lower left corner) and two half ellipses (top and right side). By randomly rotating and flipping this pattern to the other tiles, all manners of curves and loops are formed.

Of course, more complex tilings can be created, with a bit of work. This one uses five different tile patterns, each with eight elliptical arcs.


These tilings can be combined to further expand the creative possibilities. Here is another version of the above tiling, made by joining two copies of it.


The next step in the development of the coloring formula is to go beyond ellipses to general Bezier curves. This will allow for far more flexibility in making curves, albeit at a greater cost to the designer.

Animated Newton

Newton's method is a technique for solving equations that have several "roots"--the solutions to the equation. Typically, the roots are fixed points, like +/-1 and +/-i, the four roots of z4 - 1 = 0. To animate a Newton fractal, I decided to use four roots and to have them move around during the animation. In this case, the four roots move around on four different rose curves. The coloring is the typical iteration band coloring, just using black and white. And, to keep the visual noise down, I used a small number of iterations.


(See a higher-quality version on YouTube. While you're there, check out a variation based on circles.)

The technique has promise and can be expanded to different root paths and different functional forms. Here, I used a quartic polynomial because it's quick and easy, but there's no reason why rational or transcendental functions couldn't be used as well.

Phyllotaxis Square Midget

"Square" midgets are found in embedded Julia sets in the Mandelbrot set. They are so called because they generally exhibit outer structure with four-degree rotational symmetry. That structure is sometimes warped into a squarish shape, too. However, being from embedded Julia sets, they have similar structure as the Julias, which have structure similar to the part of the Mandelbrot set from which they're taken. Or, in other words, more of the same spirals.


In that respect, this one is no different. :-) I like it, though, because it shows the phyllotaxis patterns that aren't often seen with Mandelbrot and Julia sets. They're there, you just have to know where to look. This one was pulled from an embedded Julia off of the 8/21 disk of a midget off the 8/21 disk of the main cardioid. Also, I was able to clean up the "background" a bit so that the phyllotaxis shows up most prominently. If you want to go exploring around here, this image is centered at -0.388301367376806743/0.596673282113460201 with a magnification of 2E14.

What to do with 1 million iterations?

I often like to return to the Mandelbrot set for inspiration and the new year seemed like a good time. Lately, I've been playing with high-iteration, but not-deep-zoom fractals--those which require a lot of iterations but at a reasonable magnification (deep zoom on Ultra Fractal kicks in around a magnification of 1E16). This gives me the chance to look at/for new structures and to do so without waiting days for the image to appear.


This is one of my explorations. It's based on the fraction 2/9, chosen to celebrate the year 2009. I like that there's very little "background" (black) in the image; it's almost completely filled in with structure. This can give you a sense of how the boundary of the Mandelbrot set has a fractal dimension of 2: as you zoom in, the structure of the boundary becomes so dense that it fills in an area. The zoom here is a paltry 24 million, but you can already sense the space filling in.

One other feature: the inside color is Mimosa, Pantone's Color of the Year for 2009 (242/181/11 in RGB space, as near as I can tell).

Sudoku

In the game of Sudoku, a 9 × 9 grid is to be filled in with the digits 1 – 9, such that in each column, each row, and each 3 × 3 sub-grid, each of the nine digits only appears once. There are other aspects to the game that make it easier or harder as a puzzle, but it’s the challenge of the filled-in grid that appeals to me.

In this series of images, I concentrated on a 4 × 4 grid and I used shapes instead of the digits 1 – 4. I retained the requirement that each element of the four-character alphabet appear once and only once in each row, column, and in each of the four 2 × 2 sub-grids. In addition, I added an element of layering: Each finished image is a composition of four layers, with each layer being its own solved Sudoku grid. The alphabets of image elements varied across the layers, but were chosen to be consistent across the image.

Consider Sudoku 4b, shown in Figure 1. The finished image is shown in the left panel and the right panel includes outlines to show how the 4 × 4 grid to separates the 16 squares.

Figure 1: Sudoku 4b, without and with grid outline.

Studying the cells, it may seem that the elemental images are based on quarter- and half-circles. That is indeed the case and the first layer and its alphabet are shown in Figure 2.

Figure 2: First layer, layer with grid, and corner showing alphabet.

For each layer, the alphabet of elemental images was composed of rotations of a primary shape, as suggested in Figure 2. The shapes and colors of the elements in all four alphabets were chosen to be complementary and so that they would effectively show their own colors and a wide variety of colors when merged. The primary shapes are shown in Figure 3.

Figure 3: Primary shapes for Sudoku 4b image alphabets.

In Sudoku 4a, the alphabets are based on rectangles. They are variously: solid and dark, solid and light, split light/dark, or split dark/light. The four primary images, one layer’s alphabet, and the finished image are shown in Figure 4.

Figure 4: Sudoku 4a: primary images, single layer’s alphabet, and final image.

Sudoku 4c is structurally similar to 4b. In this case, the primary images are triangular regions that cover (positive space) or leave uncovered (negative space) one-quarter or one-half of the grid square. The primary images and final piece are shown in Figure 5.

Figure 5: Sudoku 4c primary images and final image.

The final image in the series, Sudoku 4d, employed Truchet tiles for its basis. Each tile has two quarter-circle bands, which can be in either a top/right or top/left orientation. The orientation, along with the dark/light coloring (dark bands on a light background or light bands on a dark background) formed one of the four dimensions. The next two were the hues of the light regions and the hues of the dark regions, each with four possibilities. Finally, in each tile, the thick bands have thin bands laid on top of them. There are four choices for the orientations of the thin bands: none, parallel to the thick bands, crossing the thick bands, and four thin bands, two parallel and two crossing. A detail showing each of the four dimensions and the final image are shown in Figure 6.

Figure 6: Sudoku 4d detail and final image.

This series of four images explored the concept of filling a 4 × 4 grid in a Sudoku-like manner, except using geometric shapes and colors to create the alphabet of elements. In addition, layering of different grids was employed to highlight the interplay between structures.

Irrational Exuberance


A number (real or complex) can be rational or irrational. A rational number is one that can be written as the ratio of two integers, such as 1/4, -2/11, or (1 + i)/(4 – 5i). When written as a decimal, a rational number either terminates (like 1/4 = 0.25) or repeats (-2/11 = -0.181818…). An irrational number cannot be written as the ratio of two integers, no matter how large the integers are. The decimal expansion of an irrational number never terminates and never repeats. Examples are the golden ratio φ, which is approximately 1.61803398875, and π, which begins 3.14159265358979. If you have a scientific calculator (or the Windows calculator under View Scientific), then most of those weird functions like sin, cos, tan, exp, and log will generate irrational numbers if you use an integer as the input.


If a number is rational, then there are an infinite number of integers by which it can be multiplied such that the result is an integer. For example, -2/11 can be multiplied by 11, 121, or -33i and the result will be an integer (-2, -22, and 6i, respectively). On the other hand, multiplying an irrational number by an integer will never result in an integer, although the product can be very close. For example, φ times 610 is approximately 987.000733.


Given an irrational number, we can break up the complex plane into blocks, each block representing a complex integer. Then, color the block by how close the product of the irrational number and the complex integer is to an integer. Each irrational number will have its own pattern. (Actually, the pattern is associated with the decimal part of the number—the integer part has no effect.)


The above images show this pattern for π (left) and 1/π (right). Both are taken from the same-sized region of the complex plane. The darker blocks correspond to integers where the product is very close to an integer; the white blocks indicate furthest away from an integer. Note that while there is a clear overall repetition to the pattern, it doesn’t exactly repeat. The only exact symmetry is rotational symmetry around 0/0, because 1, i, -1, and -i have the same effect on this analysis. Every irrational number has rational numbers by which it is well approximated, for example, π is very close to 22/7 and 333/106. These integers show up in the patterns as the centers and sizes of groups of blocks that almost repeat.


Opening this article is the pattern for the golden ratio, φ. It turns out that φ is well approximated by the ratio of adjacent Fibonacci numbers (the Fibonacci sequence begins 0, 1, 1, 2, 3, 5; each subsequent number is the sum of the two previous). Here, black (non-white) indicates relatively close to an integer and white indicates relatively far away. The black blocks are the pattern centered on 0/0. That pattern is symmetric because of the similarity between the real and imaginary numbers. Blocks of other colors show the slight differences between the pattern centered on 0/0 and the pattern centered on other Fibonacci numbers, like 89/55 or 987/610. The similarity of the pattern in various regions reflects how well the number can be modeled by a fraction, but the differences remind us that the approximation will never be exact.